Category: Concepts & Explainers

  • How Pump Head Works and Why It Matters for Water Tanks

    How Pump Head Works and Why It Matters for Water Tanks

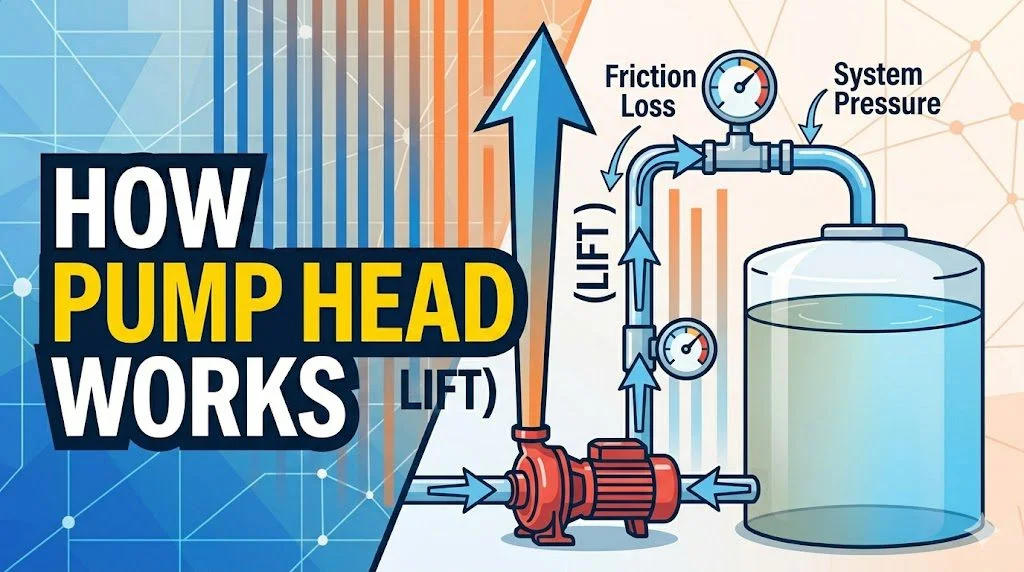
    Pump head is the total height, expressed in metres of water, that a pump can raise water against gravity and system resistance. It determines whether a pump can move water from a borehole to a rooftop tank, from a storage tank up a hill, or through a long pipe run with significant friction. Selecting a pump on flow rate alone — without checking head — is the most common cause of a pump underperforming once installed. A pump rated at 50 metres of head can lift water to 50 metres of elevation at near-zero flow, but delivers its rated flow at a lower effective head. Getting this relationship right is the whole job of pump selection.

    The quick answer

    Total Dynamic Head (TDH) is the sum of three components: static head (vertical lift), friction head (pipe resistance), and pressure head (required outlet pressure converted to metres of water).

    TDH = Static head + Friction head + Pressure head

    ComponentDefinitionTypical value
    Static headVertical lift from pump to delivery point5–40 m for most installations
    Friction headResistance of pipes, fittings, valves10–30% of static head
    Pressure headRequired outlet pressure (1 bar = 10.2 m)5–15 m for residential fixtures

    Use the pump head pressure calculator to work out TDH for your specific installation, including pipe sizing, elevation change, and outlet pressure requirements.

    How the calculation works

    Worked example: a pump at ground level filling a rooftop tank on a 3-storey building, with the tank inlet 10 metres above grade. The pipe run is 25 metres of 25mm pipe with 4 elbows. Required delivery pressure is 0.5 bar.

    1. Static head. The vertical lift from pump to tank inlet: 10 m.
    2. Friction head from pipe run. Using Darcy-Weisbach, 25mm pipe at 15 L/min generates approximately 0.8 m of friction per 10 m of pipe. For 25 m of pipe: 2.0 m.
    3. Friction head from fittings. Each 90° elbow adds roughly 0.6 m of equivalent pipe length. Four elbows: 2.4 m. Combined with the pipe run, total friction head is 4.4 m.
    4. Pressure head. 0.5 bar × 10.2 = 5.1 m — see how pressure units convert to metres of head if you’re working from a different unit.
    5. Total. TDH = 10 + 4.4 + 5.1 = 19.5 m.

    A pump rated to 25 m head at 15 L/min would handle this comfortably. A pump rated to only 15 m head would fail to deliver adequate flow — not because of motor power alone, but because it can’t overcome the total resistance. The pump curve (a head-vs-flow graph supplied by the manufacturer) shows exactly how much flow the pump delivers at 19.5 m head.

    Understanding the pump curve

    Every centrifugal pump has a characteristic performance curve showing how head and flow interact. At zero flow, the pump reaches its maximum head (shut-off head); as flow increases, achievable head falls. The intersection of the pump curve with the system curve — TDH plotted across flow rates — is the operating point.

    A pump running to the right of its best efficiency point (BEP) is working harder than designed, heating up, and wearing faster. One running far to the left is deadheading or close to it, generating heat without doing useful work. Calculating TDH correctly keeps the operating point within 80–110% of BEP flow rate.

    For installations with variable demand — a farm tank filling overnight during low demand and delivering during high-demand irrigation, for instance — the system curve shifts. The pump horsepower and flow rate calculator helps confirm the motor is sized correctly for both conditions. If you’re weighing a pump against a gravity-fed alternative entirely, it’s worth reading through how pump systems compare to gravity feed before committing to either.

    Key variables that change total dynamic head

    Pipe diameter

    Friction head is highly sensitive to pipe diameter — it scales roughly with the inverse fifth power of diameter (velocity falls with the square of diameter, and the equivalent-length term shrinks too). Doubling pipe diameter from 20mm to 40mm at the same flow rate cuts friction head by roughly 32 times, not just the 4× reduction in velocity alone would suggest. For long pipe runs, upsizing the pipe is almost always cheaper than buying a higher-head pump. As a rule of thumb, for runs over 30 metres, go one standard pipe size above the calculated minimum.

    Number of fittings

    Elbows, tees, gate valves, and check valves all add equivalent pipe length, and the difference between fitting types is large enough to matter in the total:

    FittingEquivalent length
    Ball valve0.3 – 0.5 m
    Check valve (non-return)5 – 10 m
    Globe or angle valve10 – 20 m

    A check valve is required in most pump installations, so budget for its equivalent length even in a system that otherwise looks simple. Account for every fitting in the calculation — it’s easy to under-count these on a short run and end up short on delivered flow.

    Suction lift

    Centrifugal pumps have a maximum practical suction lift of around 7–8 metres under ideal conditions (atmospheric pressure minus the vapour pressure of water). In practice, once you account for leaks, turbulence, and site elevation, 5–6 metres is the reliable limit. Exceeding it causes cavitation — vapour bubbles imploding rapidly enough to erode impellers and casings. For borehole depths beyond 6 metres, install a submersible pump instead of relying on suction lift.

    Elevation above sea level

    Atmospheric pressure drops with altitude, which reduces the net positive suction head available. At around 1,500 m above sea level, effective suction lift falls to roughly 4.5 metres; at 3,000 m, closer to 3 metres. This matters for installations in highland agricultural regions and mountain communities, where a suction-lift design that works at sea level can cavitate at altitude.

    Common mistakes

    Most pump underperformance traces back to one of a handful of selection errors — the same pattern that shows up when a tank is taking far longer than expected to refill.

    MistakeConsequenceFix
    Selecting a pump on flow rate aloneDelivers far less flow at real-world head than the spec sheet impliesCross-reference required flow against TDH on the manufacturer’s pump curve
    Ignoring friction on short pipe runsA 10 m run of 20mm pipe at 20 L/min can still add ~4 m of head, rising to over 8 m at 30 L/minCalculate friction head for every run, regardless of length
    Reading max flow and max head as one specThese are the two endpoints of the curve, not simultaneous performanceMatch pump selection to the specific flow/head combination the system needs
    Leaving no margin for expansionPump exactly meets today’s TDH and can’t absorb an added fixture, longer run, or age-related wearSize for 120–130% of current TDH

    Related calculators you might need

    The water pressure calculator converts between pressure units and head so you can work consistently in metres of water throughout the TDH calculation. If you’re designing a gravity-fed system and comparing it to a pumped one, the gravity feed flow rate calculator shows how much flow a tank at a given height can deliver without a pump. For sizing the pipe diameter in the pump delivery line, the pipe size and flow rate calculator gives friction loss per metre for any pipe diameter and flow combination. Once the pump is selected and installed, the tank refill time calculator confirms how long it will take to fill the storage tank at the actual delivered flow rate.

    Frequently asked questions

    What does pump head mean in simple terms? Pump head is how high a pump can push water, measured in metres. A pump with 20 m of head can raise water 20 metres against gravity with no flow. In a real installation, the effective head available for lift is reduced by pipe friction and required outlet pressure. Total dynamic head (TDH) is the true measure of what a pump must overcome — the number to match against the pump’s performance curve.

    How do I calculate total dynamic head for my pump? Add three components: static head (vertical height from pump inlet to delivery point), friction head (from pipe diameter, length, and fittings, using a friction loss table or formula), and pressure head (required outlet pressure converted to metres, where 1 bar = 10.2 m). Use the pump head pressure calculator for a step-by-step calculation without manual arithmetic.

    What happens if my pump head is too low? If TDH exceeds the pump’s capacity at the required flow rate, it will deliver less flow than needed — or none at all if TDH exceeds shut-off head. The pump runs continuously, heats up, and eventually fails. Common symptoms include the pump running without water reaching the tank, the tank filling slowly or only partially, or pressure cutting out at the fixtures during high-demand periods even with a full tank.

    Is more pump head always better? Not necessarily. Over-specifying head pushes the pump’s operating point to the left of its best efficiency point — low flow at unnecessarily high energy use, plus mechanical stress and the risk of pipe pressure exceeding fitting ratings. Match pump head to TDH within a 15–20% margin rather than buying the highest-head pump in the range.

    Can I use a submersible pump to fill a rooftop tank? Yes — submersible pumps are commonly used in boreholes and underground cisterns to deliver water to elevated tanks. The head rating must account for the full depth of submergence plus the height of the rooftop tank above grade. A borehole 20 m deep feeding a tank 10 m above grade needs a pump rated to at least 30 m static head, plus friction and pressure head on top.
  • What Is Hydrostatic Pressure and How Does It Affect Tank Design?

    What Is Hydrostatic Pressure and How Does It Affect Tank Design?

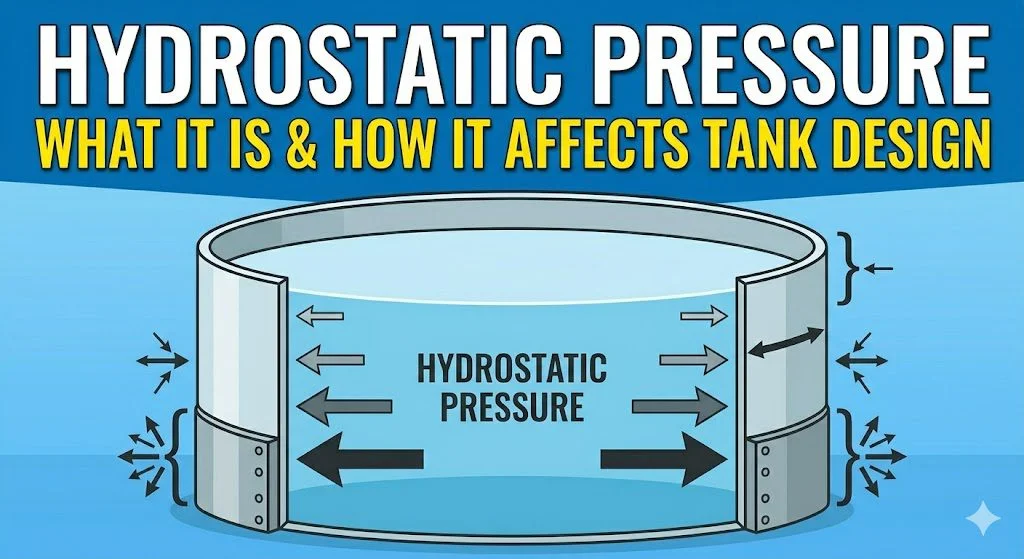
    Hydrostatic pressure is the pressure exerted by a stationary fluid on any surface it contacts, caused by the weight of the fluid above that surface. In a water tank, hydrostatic pressure acts on the tank walls and floor — and it increases with depth. At the base of a tank filled to 2 metres, the pressure is roughly 19.6 kPa (0.196 bar or 2.84 psi), regardless of the tank’s width, shape, or total volume.

    Use the hydrostatic pressure calculator to find the exact pressure at any depth in your tank — useful for checking whether fittings, outlets, and wall panels are rated for the load they will experience when the tank is full.

    The Physics: How Hydrostatic Pressure Is Calculated

    The formula is: P = ρ × g × h, where P is pressure in Pascals, ρ (rho) is fluid density (1,000 kg/m³ for fresh water), g is gravitational acceleration (9.81 m/s²), and h is the depth below the water surface in metres. This simplifies to 9,810 Pa per metre of depth, or approximately 9.81 kPa/m (0.098 bar/m, 1.42 psi/m). If you’re not used to moving between these units, our guide to water pressure in psi, bar, and kPa covers the conversions in more detail.

    Critically, hydrostatic pressure depends only on depth — not on the volume of water above. A 10,000 litre tank filled to 2 metres exerts exactly the same pressure at its base as a 100 litre tank filled to 2 metres. This is why tall, narrow tanks present more structural challenge per unit volume than wide, shallow tanks at the same capacity.

    Hydrostatic Pressure at Different Tank Depths

    Water Depth (m)Pressure at Base (kPa)Pressure at Base (bar)Pressure at Base (psi)
    0.54.90.0490.71
    1.09.80.0981.42
    1.514.70.1472.13
    2.019.60.1962.84
    2.524.50.2453.55
    3.029.40.2944.27
    4.039.20.3925.69
    5.049.10.4917.12

    How Hydrostatic Pressure Determines Tank Wall Design

    Tank walls do not experience uniform pressure. The pressure is zero at the water surface and maximum at the base. This means the lower sections of a tank wall bear the greatest structural load, and this is where failures most commonly occur in under-engineered tanks. How that load is handled differs by material — worth distinguishing from a pressure tank, which is a mechanically pressurised vessel and a different design problem entirely.

    MaterialBehaviour Under Hydrostatic LoadKey Failure Point
    Plastic (polyethylene, fibreglass)Moulded to handle pressure at rated capacity; requires a level, fully supporting surfacePoint loading from an uneven surface (a rock, an uneven pad) concentrates stress and can cause failure below rated capacity
    ConcreteStrong in compression, weak in tension; hydrostatic pressure creates tensile hoop stress that pushes to split cylindrical walls apartUnder-reinforcement — steel rebar is required to resist tensile forces that concrete alone can’t handle
    Steel (corrugated, bolted panel, welded)Relies on wall thickness and rib or corrugation geometry to resist pressurePanel-to-panel connections; any gap in sealing or loosened bolts under load results in seepage

    Underground Tanks: External Hydrostatic Pressure

    For underground tanks, the hydrostatic pressure concern reverses. External groundwater pressure pushes inward against the tank walls, trying to collapse or float the structure. An empty or partially filled underground tank in a high water table area experiences net inward pressure — the buoyancy of the tank structure working against the weight of water inside. Concrete underground tanks are routinely over-engineered to handle this scenario. Plastic underground tanks require a specific minimum water fill level to prevent flotation and inward collapse. Use the underground tank volume calculator when sizing buried installations.

    Hydrostatic Pressure and Outlet/Fitting Selection

    Every outlet, valve, bulkhead fitting, and pipe penetration in a tank wall must be rated for the hydrostatic pressure at the depth it is installed. A fitting at the base of a 2.5 m tall tank is under 24.5 kPa of continuous pressure. Fittings rated for a lower pressure will fail — not immediately, but through slow seepage that worsens over time. This is a different problem from low pressure at the tap, which is a supply-pressure issue rather than a structural one — see why shower pressure can be low even with a full rooftop tank if that’s what you’re troubleshooting. For pressurised pipework downstream of an elevated tank, use the water pressure calculator to confirm the pressure at any point in the system.

    The rule of thumb is to use fittings with a pressure rating at least twice the maximum hydrostatic pressure at installation depth — providing a safety factor that accounts for water hammer, temperature cycling, and material degradation over the tank’s service life.

    Common Mistakes

    Confusing hydrostatic pressure with water supply pressure

    Hydrostatic pressure in a tank is the structural load on the walls. Water supply pressure at a tap connected to an elevated tank is the gravitational head pressure — a separate calculation. A tank sitting 3 m above a tap delivers roughly 0.29 bar at the tap; the same tank’s base wall is under 0.20 bar of hydrostatic load if filled to 2 m. These are different values serving different design purposes.

    Installing a plastic tank on an unprepared surface

    Plastic tanks under full hydrostatic load require 100% uniform base support. Gravel, bare earth with stones, or a cracked concrete pad all create point loading that concentrates stress at specific wall locations. Manufacturers specify a compacted sand pad or smooth concrete slab for this reason. Installing on uneven ground voids warranty and risks wall failure at much lower fill levels than the tank’s rating.

    Using standard irrigation fittings for base-level tank outlets

    Standard poly irrigation fittings are often rated to 6 bar — more than enough for the hydrostatic pressure in any household tank. However, the bulkhead seal and thread engagement must also be appropriate for continuous immersion. Fittings designed for drip irrigation lines are not designed for permanent pressurised contact with standing water and will weep over time.

    Ignoring hydrostatic load when cutting inspection hatches or additional outlets

    Cutting any opening into a tank wall removes material that was contributing to structural integrity. Any new penetration creates a stress concentration point. On high tanks (over 2 m fill depth), reinforcement or a flanged fitting is mandatory around new penetrations to restore wall strength. This applies to both plastic and concrete tanks.

    Related Calculators You Might Need

    If you are using an elevated tank for gravity-fed supply, the water column pressure calculator converts your tank height directly to supply pressure at any point downstream. For understanding how pressure builds in a pump-and-tank system, the pump head pressure calculator accounts for both static head and friction losses — our guide on how pump head works explains the underlying concept. If your tank is rooftop-mounted, the weight of a full tank is a separate structural concern from hydrostatic pressure — the water tank weight calculator gives total loaded weight, and the rooftop load bearing calculator checks whether the structure can support it — see also will my roof hold a full water tank for the broader assessment.

    Frequently Asked Questions

    Does a bigger tank mean more hydrostatic pressure on the walls?

    Not necessarily. Hydrostatic pressure depends on water depth, not volume. A 10,000 litre tank filled to 1.5 m generates less base pressure (14.7 kPa) than a 500 litre tank filled to 2 m (19.6 kPa). What changes with volume is the total force on the tank wall — the same pressure acting over a larger surface area creates a larger total load. This is why very wide large-capacity tanks require thicker walls or more structural ribbing even if fill depth is modest.

    What is the hydrostatic pressure at the bottom of a 1,000 litre tank?

    It depends on the tank’s height, not its volume. A 1,000 litre cylindrical tank might be 0.9 m tall or 1.5 m tall depending on its diameter. At 0.9 m fill depth, base pressure is approximately 8.8 kPa (0.088 bar). At 1.5 m fill depth, it is 14.7 kPa (0.147 bar). Check your tank’s dimensions and use the hydrostatic pressure calculator to get the exact figure for your installation.

    Can hydrostatic pressure crack a concrete tank?

    Yes, if the tank is under-reinforced or if the concrete has cured poorly. Hydrostatic pressure generates hoop tension in cylindrical walls — concrete has very low tensile strength (roughly 10% of its compressive strength). Without adequate steel reinforcement, tensile cracking is the expected failure mode. Cracks allow water to reach the reinforcement, which then corrodes and expands, causing spalling and progressive structural failure. This is why concrete tanks require inspection every 5 to 10 years.

    Does hydrostatic pressure change if the water is moving?

    When water flows, static pressure converts partly to velocity (dynamic) pressure — total energy is conserved but distributed differently. In a moving flow, static pressure at any point is lower than when the water is stationary. For tank wall design purposes, the worst case is the tank full and water stationary — which gives maximum hydrostatic pressure. Systems are always designed for this static condition.

    How do I know if my tank is rated for the hydrostatic pressure it will experience?

    Reputable tank manufacturers publish a maximum fill height or working pressure rating. If a plastic tank is rated for 2.0 m fill depth and you are considering extending a standpipe above the tank to increase gravity pressure, you are operating outside the design envelope. For any non-standard installation, contact the manufacturer directly and get written confirmation of the rated operating pressure, including any safety margin.

  • What Is Water Tank Runoff Coefficient and How Is It Calculated?

    What Is Water Tank Runoff Coefficient and How Is It Calculated?

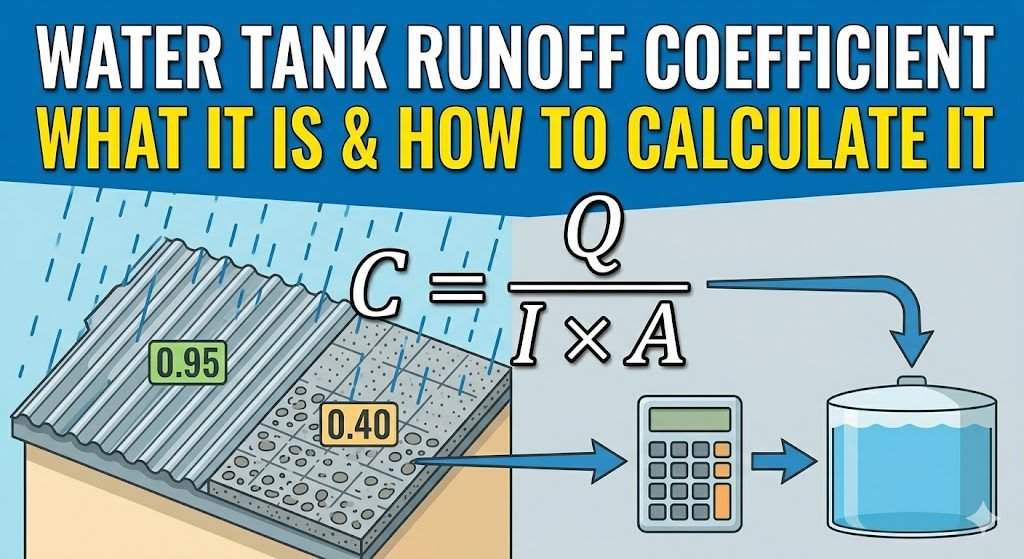
    The runoff coefficient is the fraction of rainfall that actually reaches your tank after losses from absorption, evaporation, splashing, and wetting of the catchment surface. It’s expressed as a decimal between 0 and 1: a coefficient of 0.85 means 85% of the rain falling on your roof ends up as collectible water, and the remaining 15% never makes it to the tank.

    Every step of a rainwater harvesting system depends on getting this number right. Once you have it, the annual rainwater collection calculator combines it with roof area and local rainfall to give a realistic annual yield figure.

    The Calculation: How Runoff Coefficient Is Applied

    The core formula is: Collectible volume = Rainfall depth × Catchment area × Runoff coefficient. For metric units: 50 mm of rain on a 100 m² roof with a coefficient of 0.85 gives 0.050 m × 100 m² × 0.85 = 4.25 m³ (4,250 litres). Skip the coefficient and you’d overestimate yield by 15% — which means a tank sized to run dry more often than the model predicts.

    The coefficient isn’t a fixed property of the roof material alone. It shifts with rainfall intensity, roof condition, how dry the surface was beforehand, and slope. A light drizzle on a dry tile roof loses more to initial wetting and evaporation than a heavy downpour on the same roof. The long-run average coefficients used for annual sizing already blend this variation across event types.

    Runoff Coefficients by Roof Material

    Roof MaterialTypical Runoff CoefficientNotes
    Metal roofing (Colorbond, Zincalume, tin)0.90 – 0.95Best performer; minimal absorption
    Glazed ceramic tiles0.85 – 0.90Good; some absorption at joints
    Concrete tiles0.75 – 0.85Absorbs water when dry; lower initial coefficient
    Fibreglass / polycarbonate0.90 – 0.95Similar to metal
    Painted or sealed concrete0.70 – 0.80Depends on surface condition and age
    Asphalt shingles0.70 – 0.80Absorbs and leaches more than metal
    Green / living roof0.10 – 0.30High absorption by growing medium
    Gravel-topped flat roof0.40 – 0.60High losses to absorption and evaporation

    These ranges are long-run averages. If you’re sizing a tank conservatively — where running out is the thing to avoid — use the lower bound for your roof material. If you’re estimating maximum potential yield, use the upper bound.

    Factors That Adjust the Coefficient

    Roof slope

    Steeper roofs shed water faster, cutting down evaporation time during and after rain. A roof pitched at 30° or more performs closer to the upper end of its material’s coefficient range. Flat roofs (under 5° slope) hold water longer and lose more to evaporation, pulling performance toward the lower end.

    Roof condition and age

    Cracked, porous, or moss-covered roofing absorbs substantially more water than the same material in good condition. A 20-year-old concrete tile roof may perform 10 to 15 percentage points below a new one, and lichen or moss on any surface can knock 0.05 to 0.15 off the effective coefficient.

    First-flush losses

    If your system includes a first-flush diverter, the volume it diverts reduces effective yield and is sometimes folded into an adjusted coefficient. A diverter losing 4 litres per event across 80 annual events works out to 320 litres of annual loss — subtract this from gross yield when sizing storage.

    Gutter and downpipe losses

    Water left in gutters after rain, overflow during high-intensity events, and evaporation from hot metal gutters between events all chip away at effective yield. General industry guidance in Australia applies a system efficiency factor of 0.85 to 0.90 on top of the roof coefficient to account for these distribution losses — worth checking if you’re comparing figures against a rainwater harvesting setup in Australia, where this kind of adjustment is common practice.

    Worked Example: Sizing a Tank Using Runoff Coefficient

    A homeowner in a semi-arid region has a 120 m² metal roof (coefficient 0.90) and 450 mm average annual rainfall. Annual collectible volume = 0.450 m × 120 m² × 0.90 = 48.6 m³ (48,600 litres). Applying a 0.87 system efficiency factor for gutter losses brings that down to roughly 42,300 litres of usable annual yield.

    That figure feeds directly into tank sizing — the rainwater harvesting calculator matches it against household demand and seasonal rainfall distribution to give a minimum tank size that avoids running dry. From there it’s worth checking whether that yield actually beats buying from municipal supply once installation and maintenance costs are factored in.

    Common Mistakes

    1. Using a coefficient of 1.0, or ignoring it entirely, for metal roofs. Even the best metal roofing loses 5 to 10% to wetting, evaporation, and splashback. Assume 100% collection and you’ll consistently overestimate yield. Use 0.90 to 0.95 as the realistic range.
    2. Using one coefficient year-round in climates with sharp wet and dry seasons. A dry-season roof is hotter and drier, so initial wetting losses and evaporation are higher for every event. An annual average of 0.80 can mask a dry-season effective coefficient of 0.65 and a wet-season figure of 0.88. If you’re sizing for dry-season survival, use dry-season numbers for that calculation.
    3. Applying the coefficient to roof surface area instead of catchment area. Catchment area is the horizontal projection of the roof, not its surface area — rainfall is measured vertically, so a steeply pitched roof covers more surface than footprint. The roof catchment area calculator converts roof dimensions to the correct horizontal figure.
    4. Applying a textbook coefficient to a roof that hasn’t been inspected. A roof listed as concrete tile gets the standard concrete-tile coefficient in most calculations — but if it’s covered in moss with cracked or missing tiles, actual performance can run 20 points below that figure. Inspect the roof before using any table value in a sizing calculation.

    Related Calculators You Might Need

    Once you have your runoff coefficient and roof area, the annual rainwater collection calculator is the natural next step — it applies your coefficient to local rainfall data to give an annual yield. From yield, the rainwater harvesting calculator sizes the storage tank to your demand profile. If your system includes a first-flush diverter and you want to factor its volume loss into yield, the first flush diverter size calculator gives the diverter capacity, which you can subtract from gross yield. Finally, the rainwater savings calculator translates your adjusted yield into annual cost savings against mains supply.

    Frequently Asked Questions

    What runoff coefficient should I use for my roof?

    Start with the material type from the table above, then adjust for slope, age, and condition. For a clean metal roof at moderate pitch, 0.90 is a reliable working figure. For concrete tiles in average condition, 0.80. If you’re unsure of your roof’s condition, use the lower end of the range — it produces a more conservative, safer tank size.

    Does the runoff coefficient change with rainfall intensity?

    Yes. During heavy rainfall (over 25 mm/hr), coefficients approach the upper limit of the range — there’s little time for evaporation and surface absorption is overwhelmed by volume. During light rain (under 5 mm/hr), initial wetting losses are proportionally larger and coefficients drop toward the lower end. Annual yield calculations using average rainfall implicitly blend both, which is why the long-run average coefficient is the right value for sizing.

    How do I measure my actual runoff coefficient?

    Know your roof area precisely, measure rainfall with a gauge, measure how much actually enters the tank, then divide tank inflow by (rainfall × roof area). Do this across 10 or more events of varying intensity and average the results. It’s more work than reading a table, but it accounts for your specific roof, gutters, and downpipes in a way no standard figure can.

    Does roof colour affect the runoff coefficient?

    Colour affects surface temperature, not porosity. A dark roof in full sun evaporates water faster during and right after light rain, which can shave 0.02 to 0.05 off the effective coefficient compared to a light-coloured roof of the same material. For heavy rainfall events the effect is negligible. It’s worth accounting for in hot climates with frequent light drizzle; elsewhere it’s not a meaningful factor.

    Can I increase my runoff coefficient?

    The main levers are roof material and condition. Replacing cracked concrete tiles with metal roofing typically raises the effective coefficient by 0.10 to 0.20. Cleaning moss, lichen, and debris off any roof helps noticeably, and improving gutter capacity to prevent overflow during heavy rain retains water that would otherwise be lost. None of this changes how the roof catchment area calculator computes your catchment size, but it directly increases the yield that coefficient delivers.

  • What Is TDS in Water and Why Does It Matter for Storage?

    What Is TDS in Water and Why Does It Matter for Storage?

    Total Dissolved Solids (TDS) is the combined concentration of all inorganic and organic substances dissolved in water — measured in milligrams per litre (mg/L) or parts per million (ppm), where 1 mg/L = 1 ppm. It includes calcium, magnesium, sodium, potassium, carbonates, chlorides, sulfates, and trace amounts of metals and organics. TDS does not measure bacteria or suspended particles — it specifically captures what is chemically dissolved and invisible to the naked eye.

    Use the TDS water calculator to assess your stored water quality against WHO and national drinking standards.

    What TDS Levels Mean in Practice

    TDS Level (ppm)ClassificationTaste ProfileSuitable For
    < 50Very lowFlat, blandNot recommended for prolonged drinking
    50–150LowClean, slightly blandDrinking, cooking, RO permeate
    150–300AcceptableNeutral to pleasantIdeal for drinking
    300–600ModerateSlightly mineralAcceptable for drinking
    600–900HighNoticeably mineralMarginal for drinking; taste complaints common
    900–1,200Very highSalty or metallicNot recommended for drinking
    > 1,200UnsafeStrongly salineUnsuitable for human consumption

    WHO does not set a single enforceable TDS limit; instead it classifies palatability, with water rated “good” up to roughly 600 ppm and quality declining noticeably above 300 ppm. Most national standards cap acceptable TDS between 500 and 1,000 ppm. India’s BIS standard sets 500 ppm as desirable and 2,000 ppm as the maximum permissible limit. The US EPA sets a secondary standard of 500 ppm (non-enforceable, taste-based). If stored water is developing an off-taste alongside a rising TDS reading, our guide on why water tastes or smells bad after storage walks through the likely causes.

    Why TDS Changes During Tank Storage

    Water sitting in a tank does not stay chemically static. Four mechanisms typically drive TDS up over time:

    1. Evaporation. Open or poorly sealed tanks lose pure water vapour while dissolved solids stay behind, concentrating what remains. As a rough rule, a tank losing 5% of its volume to evaporation will see TDS rise by roughly a similar margin — the relationship isn’t perfectly linear, but it’s close enough to use as a planning estimate.
    2. Material leaching. Freshly cured concrete tanks add calcium hydroxide and other alkalis, raising both TDS and pH. Corroding iron or galvanised steel tanks contribute iron and zinc ions. Plastic tanks are largely inert but can leach additives if they’re low-grade or UV-degraded.
    3. Biological activity. In warm, light-exposed, or poorly treated tanks, algae and biofilm growth produce metabolic by-products that add to organic TDS.
    4. Disinfection by-products. Residual chlorine reacts with organic matter to form by-products that also register as TDS. For the chemistry behind this, see how chlorination of water tanks actually works, and use the chlorine dosage calculator to dose accurately and avoid over-chlorination.

    TDS and Storage Safety: What the Number Does Not Tell You

    TDS is a proxy measure, not a safety guarantee. Low TDS water is not automatically safe — pathogens, pesticides, and industrial contaminants may be present at dangerous levels while TDS reads below 100 ppm. Conversely, high-TDS water from a mineral-rich aquifer may be microbiologically safe but taste unpleasant and cause scaling in appliances.

    TDS testing should always be paired with pH testing and, where there is any doubt about the source, microbiological testing. The water pH adjustment calculator helps correct pH imbalances that often accompany abnormal TDS readings.

    For long-term tank storage, TDS alone cannot confirm water is safe to drink after several weeks. Pair TDS readings with a residual chlorine check and a visual inspection — cloudiness, colour change, odour, or a layer of sediment at the bottom of the tank are all signs worth investigating on their own, regardless of what the TDS meter reads.

    TDS Thresholds for Specific Uses

    ApplicationMaximum TDS (ppm)Notes
    Drinking water (WHO)600Taste acceptable up to ~300 ppm
    Baby formula preparation< 100Low mineral content required
    Aquarium (freshwater)< 500Species-dependent
    Hydroponics / irrigation< 1,500Depends on crop type
    Livestock (cattle)< 3,000Short-term tolerance higher
    Reverse osmosis membrane< 2,000 feedHigher TDS accelerates membrane fouling
    Boiler/hot water system< 200Scaling risk above this level

    Common Mistakes

    Treating TDS as a pass/fail safety test

    A TDS reading of 250 ppm tells you the total dissolved load but nothing about what’s dissolved. Arsenic contamination, nitrates, and E. coli are invisible to a TDS meter. Treat TDS as a screening tool and first-line quality indicator — not a definitive safety assessment.

    Ignoring TDS rise in sealed tanks during extended storage

    Even sealed tanks concentrate dissolved solids slowly over weeks, through minor evaporation at vents and leaching from tank materials. Water stored longer than 30 days should be re-tested. The safe water storage duration calculator estimates how long treated water remains safe under your conditions.

    Assuming very low TDS means superior quality

    RO-purified or distilled water with near-zero TDS is demineralised. Drinking very low-TDS water over long periods can leach minerals from body tissue and is mildly corrosive to metal plumbing. WHO recommends a minimum of 100 ppm for regular drinking water.

    Testing TDS once and assuming it stays constant

    TDS shifts with season, supply-source variation, tank condition, and treatment. Test stored water at least quarterly, and again after any change to the supply source or tank.

    Related Calculators You Might Need

    TDS is one part of a broader water quality picture. If elevated TDS is coming from water hardness, the water hardness calculator will tell you whether scaling is a risk for your appliances and pipes — our guide on how water hardness affects your tank covers the mechanism in more depth. If the storage itself is the source of contamination, the water tank disinfection calculator guides you through a cleaning protocol. For water that requires UV treatment rather than chemical dosing, the UV disinfection tank calculator sizes the system correctly for your flow rate. And if you’re buying a filtration unit to reduce TDS, confirm it can handle your demand with the water filter flow rate calculator.

    Frequently Asked Questions

    What is a good TDS level for drinking water?

    Between 150 and 300 ppm is considered ideal — enough minerals for taste and health, below the threshold where most people notice off-flavours. The 300–600 ppm range is acceptable but may taste noticeably mineral. Above 600 ppm, palatability drops sharply. Below 50 ppm is demineralised and not recommended for regular long-term consumption.

    Can high TDS make you sick?

    High TDS alone is not acutely toxic for most people — it depends entirely on what’s causing the reading. Elevated TDS from calcium and magnesium is generally harmless. TDS elevated by nitrates, arsenic, heavy metals, or industrial contaminants is a direct health hazard at much lower concentrations. A TDS meter can’t tell these apart; lab analysis is needed to identify specific ions.

    How do I reduce TDS in my storage tank?

    Treat or replace the water — there’s no shortcut. Reverse osmosis reduces TDS by 90–98%. Distillation removes nearly all dissolved solids. Ion exchange softeners reduce hardness-related TDS. Boiling does not reduce TDS — it concentrates it by driving off pure water as steam. If TDS is rising because the tank itself is leaching, the surface needs cleaning or lining.

    Does chlorination affect TDS?

    Yes. Chlorine or bleach introduces sodium, chloride ions, and disinfection by-products, all of which raise TDS slightly. A standard shock dose for tank disinfection typically adds 5 to 15 ppm — negligible for most applications, but dosing accuracy still matters. The bleach to water ratio calculator prevents over-dosing that would unnecessarily spike TDS and create off-flavours.

    Why does my TDS reading spike after heavy rainfall fills the tank?

    Roof runoff carries atmospheric dust, bird droppings, leaf decomposition products, and surface contaminants, all of which dissolve into the collected water and raise TDS. First-flush events — the first few minutes of rainfall — carry the highest contamination load. A first-flush diverter removes the most contaminated initial runoff before it reaches the tank, protecting baseline TDS. After major rain events, re-test TDS before using the stored water for drinking.

  • How Chlorination of Water Tanks Actually Works

    How Chlorination of Water Tanks Actually Works

    Chlorination kills or inactivates bacteria, viruses, and protozoa by oxidising their cell membranes and disrupting metabolic processes. For stored water, the effective dose is 2–5 mg/L of free chlorine (also expressed as 2–5 ppm), held in contact for a minimum of 30 minutes before the water is used. The key variables — tank volume, initial contamination level, pH, and water temperature — all affect how much chlorine you need and whether a residual remains after treatment. This article explains the chemistry, the dose calculation, and the practical steps for disinfecting a storage tank. If you’re weighing chlorination against other disinfection methods, our guide on chlorine vs UV vs filtration covers the trade-offs.

    The quick answer

    To disinfect a tank, you need to know its volume and whether you are doing routine maintenance or treating a contaminated tank. WHO guidelines recommend 0.5 mg/L free chlorine residual after 30 minutes of contact time for routine disinfection. For a contaminated or newly installed tank, dose to achieve 2 mg/L residual after contact.

    ScenarioTarget residualSodium hypochlorite (5%)Contact time
    Routine maintenance0.5 mg/L10 mL per 1,000 L30 min
    Post-contamination shock2 mg/L40 mL per 1,000 L30–60 min
    Algae or heavy turbidity5 mg/L100 mL per 1,000 L60 min minimum

    Use the chlorine dosage calculator to compute the exact amount of chlorine product required for your tank volume and target residual.

    How the calculation works

    The dose formula is: Chlorine product volume = (Tank volume in litres × Target dose in mg/L) ÷ (Product concentration % × 10,000). For a 5,000-litre tank dosed to 2 mg/L using 5% sodium hypochlorite (household bleach):

    Volume = (5,000 × 2) ÷ (5 × 10,000) = 10,000 ÷ 50,000 = 0.2 litres = 200 mL

    This is the amount of bleach to add, not the amount of active chlorine. Bleach concentration varies by brand — always check the label. Granular calcium hypochlorite (65–70% available chlorine) requires a very different quantity: for the same scenario, approximately 15 grams for a 5,000-litre tank at 2 mg/L. The bleach to water ratio calculator handles both liquid and granular forms.

    The chemistry of chlorine disinfection

    When sodium hypochlorite (NaOCl) dissolves in water, it produces hypochlorous acid (HOCl) and hypochlorite ion (OCl-). HOCl is the active disinfecting species — it is substantially more effective than OCl-. The ratio between the two depends on pH. At pH 7.5, roughly 50% of free chlorine is in the HOCl form. At pH 8.5, only about 10% is HOCl — meaning at high pH you need significantly more chlorine to achieve the same kill rate (EPA Guidance Manual for Compliance, 1999). For the full mechanism behind why this matters, see how chlorination of water tanks actually works.

    Temperature also matters. Chlorine reacts faster at higher temperatures but dissipates more quickly. At 25°C, a well-dosed tank may lose half its free chlorine residual within 48–72 hours through oxidation of organic matter, UV degradation (in uncovered tanks), and off-gassing. An enclosed, dark tank at moderate temperature retains residual for considerably longer. The safe water storage duration calculator models this decay based on your storage conditions.

    Key variables that change the required dose

    Water pH. As described above, high pH (above 8.0) dramatically reduces chlorine effectiveness. If your source water is alkaline — common with borehole or hard water supplies — test pH before chlorinating and consider acidifying to pH 6.5–7.5 with citric acid or CO₂ injection before adding chlorine. Use the water pH adjustment calculator to determine the adjustment dose.

    Turbidity and organic load. Chlorine reacts with organic matter — soil particles, algae, biofilm — to form disinfection by-products (DBPs) and is consumed in the process without providing any disinfection. WHO recommends water be clarified to below 1 NTU before chlorination. A visibly turbid tank may consume 5–10 mg/L of chlorine just in DBP formation before any residual remains. Always settle and filter heavily turbid water before chlorinating.

    Tank condition and biofilm. A tank that has never been cleaned accumulates biofilm — a bacterial community embedded in a protective polysaccharide matrix. Chlorine at normal doses does not penetrate mature biofilm effectively. Tanks must be drained, physically scrubbed, and rinsed before chemical disinfection. Shock chlorination alone of a fouled tank produces a false sense of safety. Sediment buildup is often a sign this hasn’t been done recently — see why is there sediment at the bottom of my water tank.

    Chlorine product age and storage. Liquid bleach degrades at roughly 20% per month at room temperature. A bottle stored for 6 months at 30°C may have lost 50–60% of its stated concentration. Always check the manufacture date and factor in degradation — or use fresh product. Granular calcium hypochlorite is more stable if kept dry and sealed, retaining potency for 2–5 years.

    Common mistakes

    Dosing by tank size alone without accounting for concentration. Adding “one capful” of bleach to a 10,000-litre tank based on a rough estimate delivers an unknown dose. Calculate using the exact product concentration and target residual. Under-dosing leaves pathogens alive. Over-dosing (above 5 mg/L free chlorine) creates taste and odour problems and may form excessive trihalomethanes.

    Not testing for residual after contact time. The dose calculation gives you the starting concentration, not the end result. Chlorine demand — the amount consumed by organic matter and reactions in the water — reduces the residual. After 30 minutes, test with a DPD test kit or strip to confirm at least 0.2 mg/L free chlorine remains. If residual is zero, re-dose and wait. If it never holds residual, the tank requires physical cleaning first.

    Chlorinating without isolating the tank. If the supply line feeds directly into the distribution system, chlorinating the tank without isolation will push high-chlorine water into pipes serving sinks and appliances. Isolate the tank outlet valve before dosing. Only reconnect after testing confirms the residual has dropped to below 0.5 mg/L — or flush the tank before reconnecting.

    Ignoring pH when treating borehole water. Borehole water commonly has pH 7.8–8.5 and high hardness. At these pH levels, chlorination is inefficient — you may dose correctly and still leave viable pathogens because HOCl is too low a fraction of the free chlorine. Test and correct pH before dosing. This single step is the most commonly skipped in rural and peri-urban settings.

    Related calculators you might need

    If you are treating a contaminated tank, start with the water tank disinfection calculator, which walks through the full disinfection sequence including drain-down, rinsing, and re-dosing phases. For tanks where biofilm or iron bacteria are the problem, the potassium permanganate dosage calculator provides an alternative oxidative treatment — see potassium permanganate water treatment for how this method works. If you need to assess your water’s overall quality before deciding on a treatment approach, the TDS water calculator gives a baseline reading of dissolved solids. For long-term water quality monitoring, the water hardness calculator helps assess scaling risk that affects chlorine contact efficiency in pipes and fittings.

    Frequently asked questions

    How much bleach do I add to a 1,000-litre water tank? For routine disinfection using 5% sodium hypochlorite (household bleach), add approximately 10 mL (two teaspoons) per 1,000 litres. For shock disinfection after contamination, use 40 mL per 1,000 litres. Wait 30 minutes, then test with a chlorine test strip to confirm a residual of at least 0.2 mg/L before use. Adjust if your bleach concentration differs — check the label.

    How long does chlorine last in a water tank? In a covered, dark, well-maintained tank with low organic load, a 0.5 mg/L residual typically falls below detectable levels within 3–5 days at 25°C. In an open or algae-affected tank, this may happen within hours. WHO recommends re-testing residual every 24–48 hours for stored drinking water and re-dosing if it drops below 0.2 mg/L. Use the safe water storage duration calculator to estimate based on your conditions.

    Is it safe to drink water after chlorinating a tank? Yes, provided the free chlorine residual is between 0.2 and 0.5 mg/L at the point of consumption (WHO Guidelines for Drinking-water Quality, 2022). Above 5 mg/L, the water should not be consumed without dilution or further treatment. Always test with a DPD kit or test strip before resuming use. If residual exceeds 1 mg/L after contact time, flush the tank until it drops to an acceptable level.

    Why does my chlorinated tank still smell bad? Persistent odour in a chlorinated tank usually indicates chloramines — compounds formed when chlorine reacts with ammonia or organic nitrogen. Chloramines are a sign of under-treatment (not enough chlorine to complete oxidation) or high organic load in the water. The fix is to shock-dose to breakpoint chlorination — typically 7–10 mg/L — which fully oxidises the nitrogen compounds. After breakpoint, the odour disappears and free chlorine residual is restored. Persistent bad taste or smell that doesn’t resolve this way may have a different cause — see why does my water taste or smell bad after storage.

    Can I use swimming pool chlorine for drinking water tank treatment? Only if it is pure calcium hypochlorite without stabilisers. Many pool products contain cyanuric acid (a stabiliser) which is not approved for drinking water use. Look for food-grade or NSF-certified calcium hypochlorite at 65–70% available chlorine. Trichlor and dichlor tablets used in pools are not suitable for potable water treatment.